
Why Do You Need Infographics
Sooner or later, any blogger starts to think about how to make readers stay longer on their website. One way to achieve this is by means of infographics. It helps communicate the information better and enhances the readers’ willingness to continue reading. Here is an infographic example, combining a chart, a diagram and map.
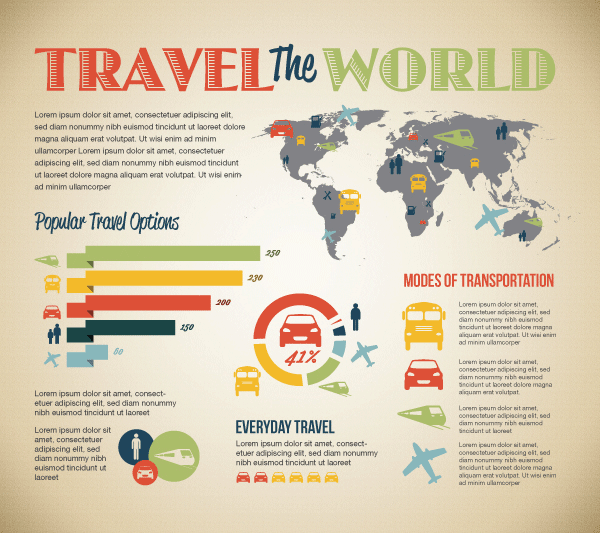
Such posts draw more attention and increase the average time spent on your website. What’s more, if infographics gets reposted on another blog, your brand name will most likely be mentioned, thus enhancing brand recognition.
Is it easy to create infographics? Most solutions presented in this post are tailored to an average user without any specific knowledge. You just upload the data on the platform, choose a relevant template and the graph is ready.
To save time, you can always delegate this task to a freelancer. Here are some platforms where you can hire a designer:
Graphics
Some of the best tools to make a stunning graphic to communicate complex data to your audience are shown below. These platforms feature various charts, diagrams, maps and other types of illustrations, and all of them offer a free plan or trial to test the platform.
Canva
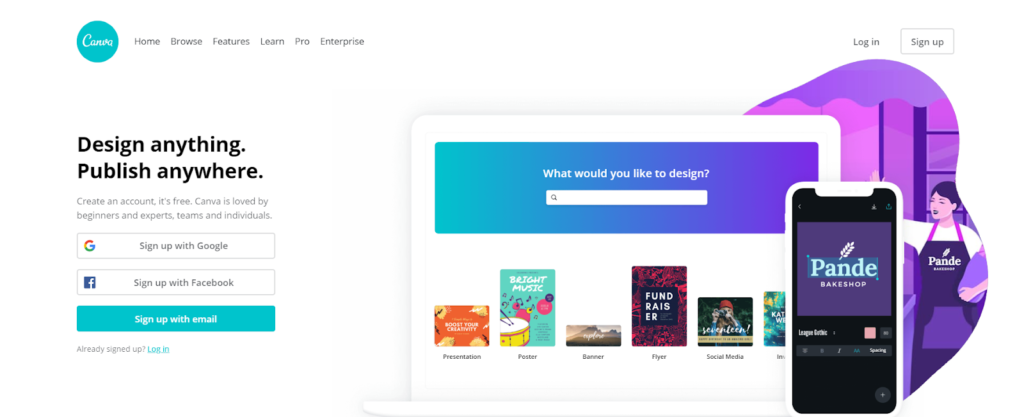
Canva is an industry leader, allowing you to create graphs, edit images and even order prints of your designs for delivery. With Canva’s graph maker, you can create amazing diagrams and graphs in under a few minutes. There are over 20 professionally designed and embeddable graph templates available for customization.
Here is an example of what you can do on Canva:

This software for infographics will be equally suitable for both beginners and professionals with its intuitive drag-and-drop interface. There is a free plan to start with, featuring access to 1GB storage, over 8,000 templates and two folders. Premium options start from $12.95 per team member/per month.
PiktoChart
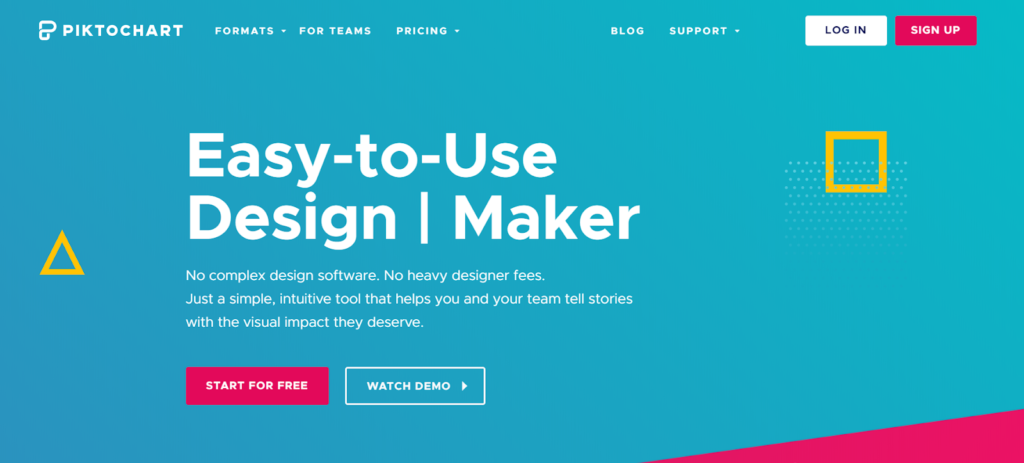
PiktoChart is an online design tool for creating infographics, social media images, presentations, reports, flyers and posters. You’ll have access to plenty of charts and maps, thousands of images (you can also upload your pictures), and more. In contrast to many other tools, PiktoChart provides SEO-focused graphics that will not only present the data but also improve the page ranking on Google. There are multiple sharing options including email, download, ebook, blog embed and more.
PiktoChart offers a Pro plan for $29 per month and a Pro team plan for $99 per month (up to six users) if paid monthly. You can also sign up for free to test the offer. Nonprofits, teachers and students can apply for special pricing.
Easel.ly
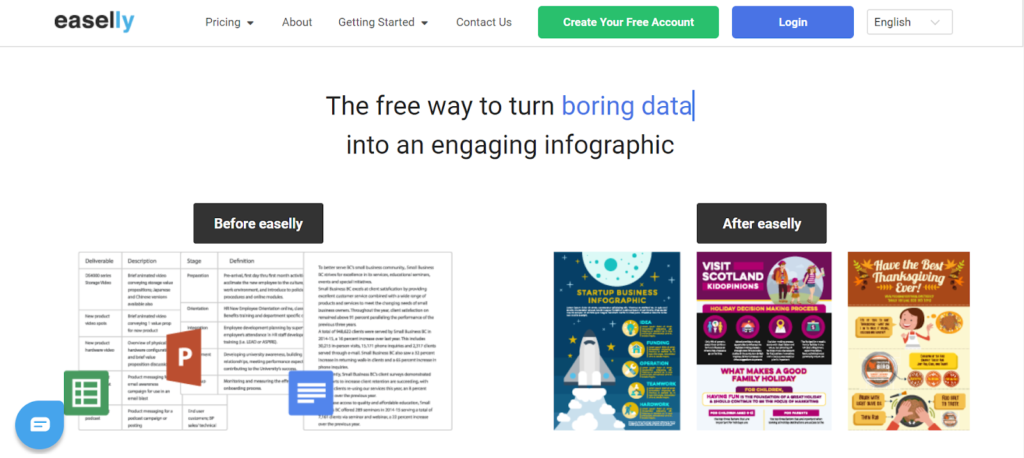
Easel.ly is an online infographic maker allowing you to create visual reports, presentations, timelines, resumes and more. You simply choose a template, customize it and share it with your readers. The tool claims to have helped over three million people create over six million graphics, and it is just the beginning.
Easel.ly offers basic features for free and allows you to embed or share the project. To unleash your creativity, purchase a Pro plan for just $4 per month and access over 300 templates and one million images, then download your project as a PDF, JPEG or PNG file. There is special pricing for teachers, students and enterprises. The cost is modest compared to other infographic tools.
Visme
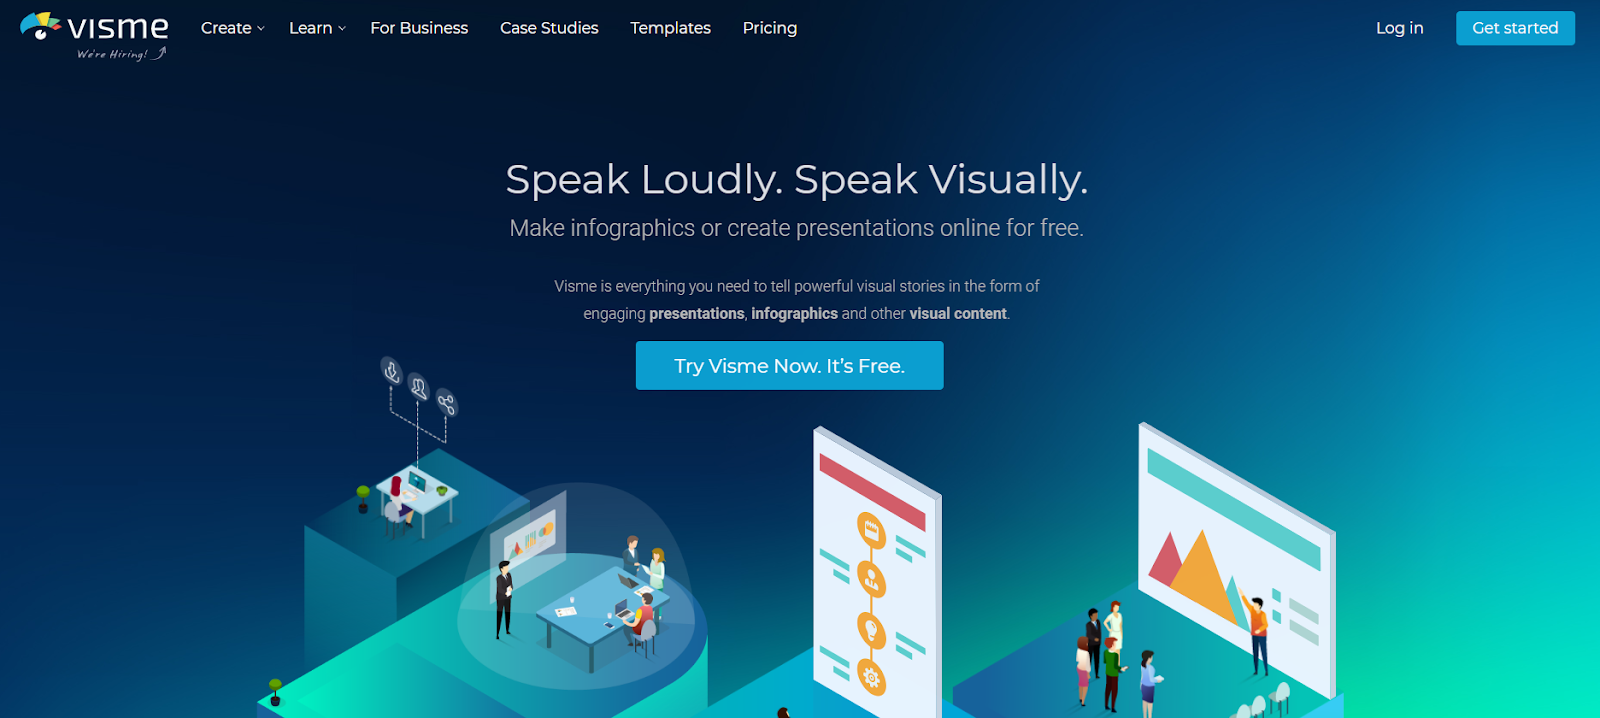
Visme is a free infographic software for creating all types of visual content: infographics, presentations, charts and graphs, documents, printables and social media graphics. Users can choose a template or work with pre-designed blocks to make a design of their own. More than 3.6 million customers have already taken advantage of Visme’s technology to create stunning visuals. To help you get started, there are video tutorials, ebooks, handbooks, live webinars, case studies and a blog.
Visme offers three premium plans: Single for $25 per month (billed annually), Team starting from $50 per month for two users to $375 for 15 users, and an Enterprise plan with a custom price. Nonprofits, teachers and students are eligible for a discount. Start by watching this short overview:
Infogram
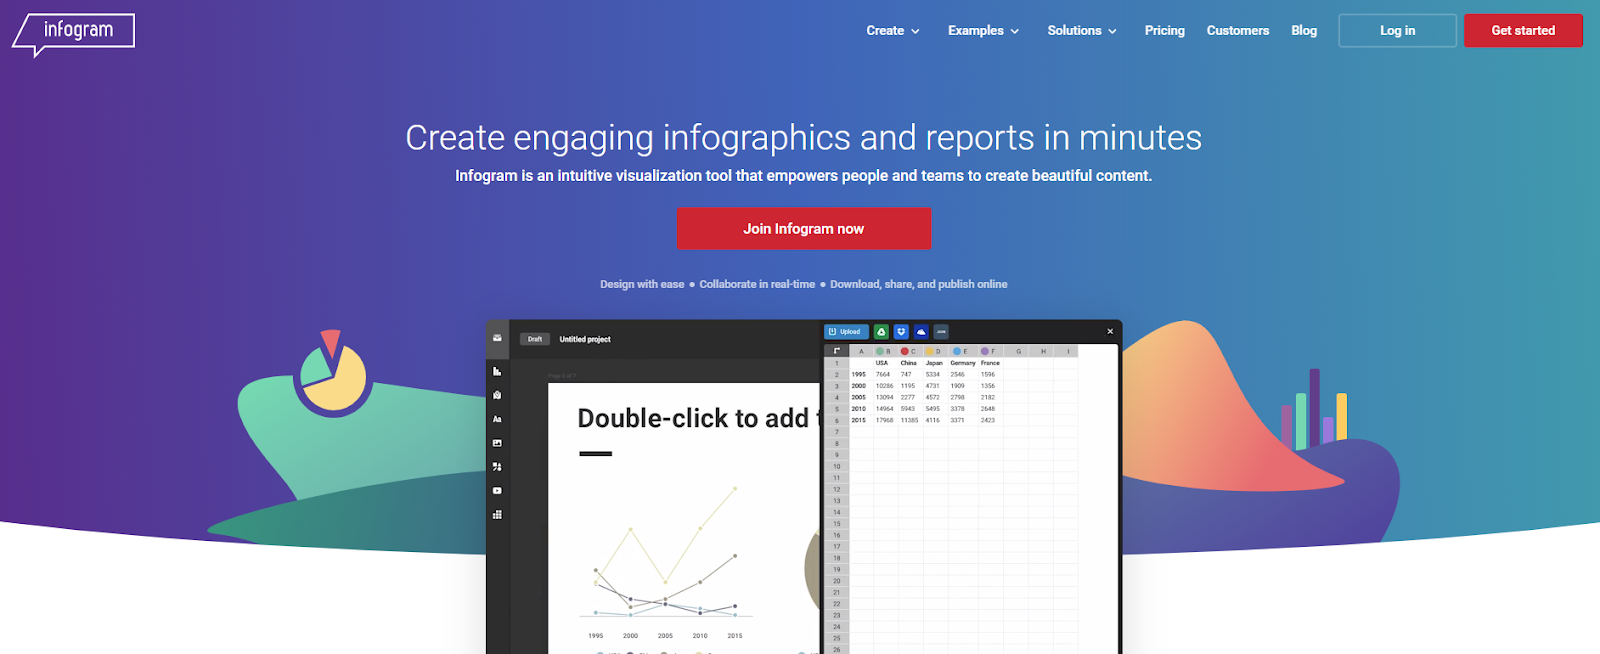
Infogram allows you to create Infographics, Facebook posts, reports, slides, dashboards, maps and charts. The program offers an industry-tailored approach for marketing teams, educational institutions, nonprofits, governments, media and more.
Infogram has a free plan for up to ten projects with five pages per project, various chart and map types, object animations and other features. And there are four premium plans: Pro for $19 per month, Business for $67 per month, Team for $149 per month and Enterprise for a custom price.
Video Infographics
Animated videos are another great way to communicate your ideas to the audience, especially when it comes to complex information. However, video technology has never been cheap, until quite recently. The latest software for infographic animation allows even small businesses to take advantage of now affordable visual content. Below, there are a few tools that let customers create awesome videos in no time!
Animaker
Animaker is a cloud-based program for creating high-quality animated videos and presentations. The platform claims to be the world’s first video infographic maker and holds the largest single selection of design elements with over 3,000 maps, 1,000 icons, 100 charts as well as numerous sound effects, music tracks and voice-overs. Customers can create a video in six different styles such as infographics, typography and whiteboard to name a few, or mix various styles in one project, and then export their video in full HD quality. To top it all off, Animaker supports vertically optimized videos tailored to mobile devices.
You can start exploring the program for free to create unlimited videos that are up to two minutes long, and export up to five projects per month (SD quality is available for YouTube videos). You’ll get access to a limited number of characters, charts and icons as well as sound effects and music tracks. Premium options start from $12per month.
To see examples of videos you can make on Animaker and get tips, check out the company’s official channel on YouTube. You can start by watching this demo:
Renderforest
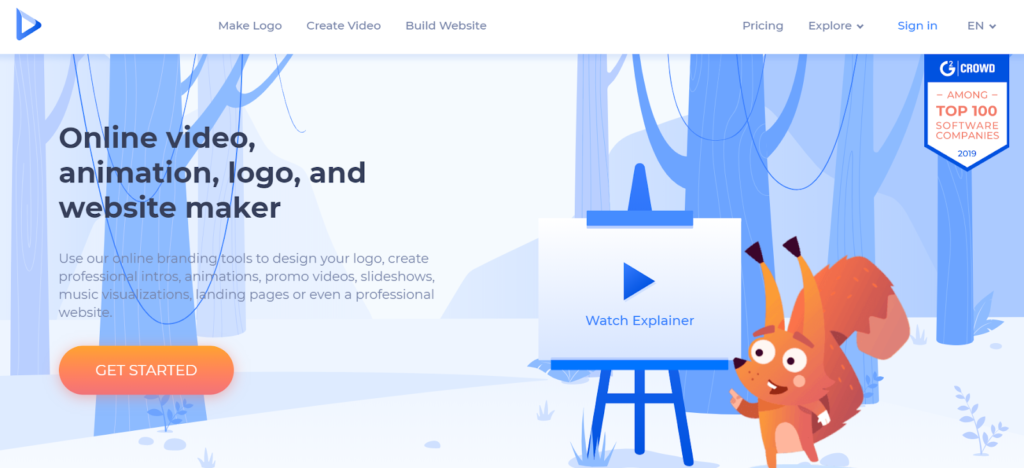
Renderforest is another cloud-based video, animation, logo and website designer. It is a great all-in-one solution to provide your business with all kinds of visuals such as intros, animations, presentations, infographics, kinetic typography, music visualizations, product videos, mobile app ads, landing pages and even a top-notch website in under one hour. Renderforest claims to have served over 8,000,000 clients and 15 million projects, having gathered more than 3,000 positive reviews. The program was awarded Top 100 software companies of 2019.
The best thing is that you can try Renderforest for free: Unlimited 360p videos with watermarks up to three minutes long, 500 MB storage, access to a few music tracks and unlimited low-quality logos. To avoid watermarks and access more features, you can purchase a monthly/yearly subscription or pay per product.
Renderforest also features a YouTube channel with multiple how-to videos and project examples. You can start by watching this introductory video:
Biteable
Biteable claims to be the world’s simplest video maker. With Biteable, you can create literally anything visual including ads (even ads for Facebook, LinkedIn and Twitter), animated texts, logos, cartoons, channel trailers, commercials, explainers, infographics, intros, outros, presentations, slideshows, video resumes, Instagram videos, YouTube videos and more. To facilitate the process, you can start with one of the numerous video templates.
Just like other video creators, Biteable offers a free option in addition to paid plans. The free account allows you to create and edit 10 videos and share them with watermarks, with access to basic content and 24/7 customer support service. Paid plans start from $20 per month if billed annually. In comparison to similar platforms, Biteable is less cost-efficient, because you can create only one video without a watermark with a Starter subscription and up to three videos with a Pro plan. There is a YouTube channel, and you can get an overview of the platform by watching this video:
Map Tools
Some bloggers prefer to illustrate their traveling experience by marking the countries they’ve visited on a map. Businesses use map tools to demonstrate their brand presence worldwide or other vital statistics.
Google Charts
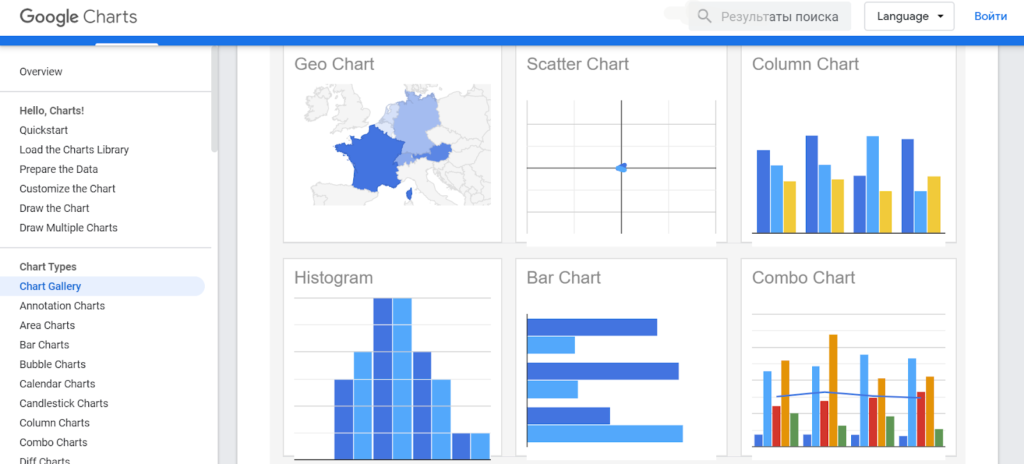
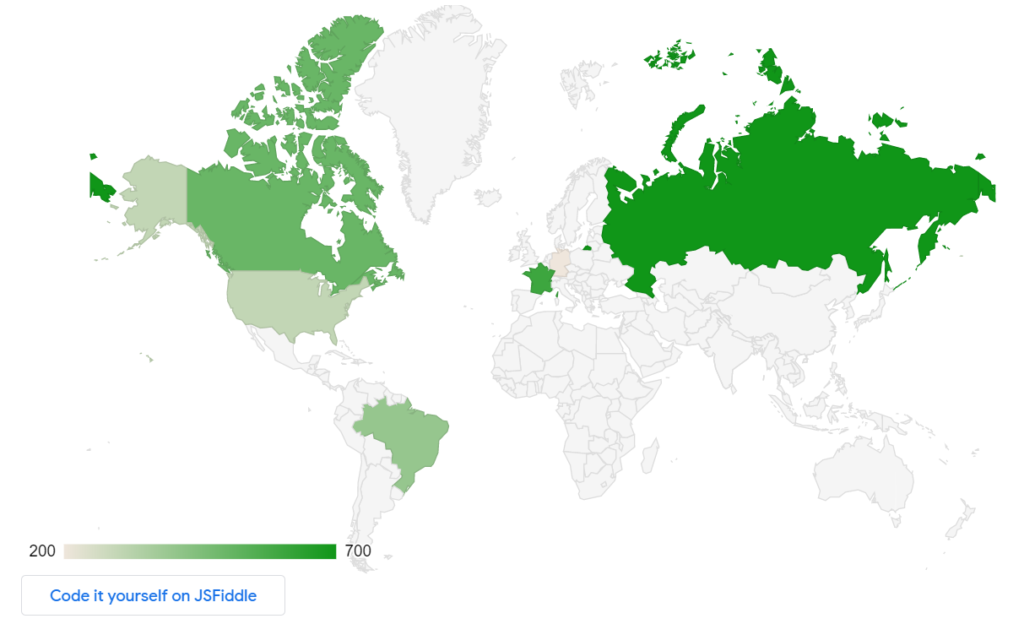
Google Charts is a simple yet powerful free tool providing a variety of interactive charts. With this tool, you’ll be able to upload numerous maps on your blog in region, marker or text modes and color the project as needed. In addition to maps, there are all kinds of charts including column, histogram, combo, waterfall, treemap, etc. Graphics can be easily embedded in your blog with the help of a JavaScript. The tool is free of cost.
Here is an example of a map built on Google Charts:
Chartsbin

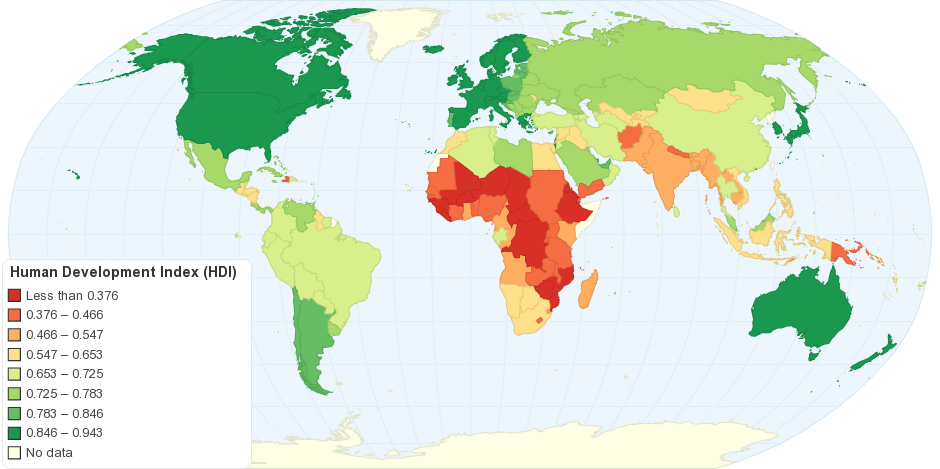
ChartsBin is another free resource for creating interactive maps: bar-chart, pie-chart, choropleth, static map and more. The tool is easy to use because it doesn’t require installation. Just sign up on the website, create a map and then export it as an image or embed the map by copying and pasting HTML code in your website. Also, there are various zoom levels and colors.
You can start by exploring projects presented on the website to get an idea of what kind of map is right for you. Here is an example of a map built on ChartsBin:
Collaborative working
In case you want all your team members to have access to your project and be able to edit it and leave comments, consider trying collaborative workspaces. These online tools are tailored to develop and edit a project from anywhere in the world, and sometimes you can even share the process with clients to bring them up to speed.
Cacoo
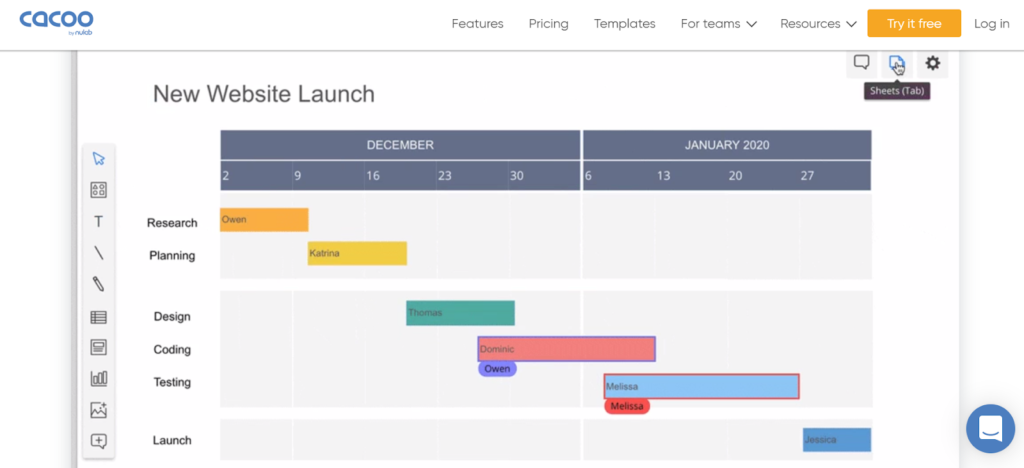
Cacoo is a cloud-based solution for real-time team collaboration. It allows your team to create, edit and comment on documents, and it sends activity notifications. Cacoo features a great selection of various templates and charts and allows you to upload your own pictures and screenshots. You can begin with a blank canvas or choose one of the templates. It is even possible to share projects with clients, whether they are registered with Cacoo or not. You can export charts, embed them or visualize them as a presentation.
Just like other applications, Cacoo has tailored solutions for project management, product design, marketing and more. You can start with a free trial and then pay $5 per user (three users minimum) if billed annually.
Creately
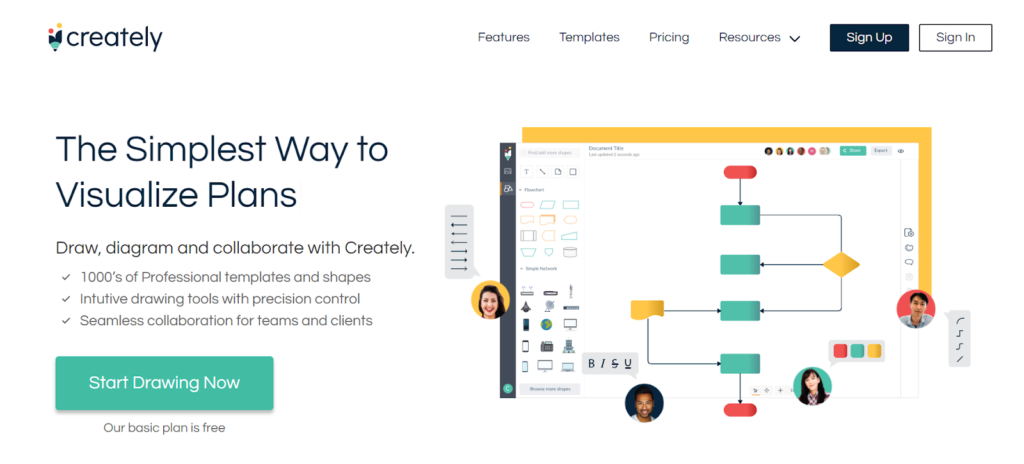
Creately is a compact online space for real-time team collaboration. You can create flowcharts, org charts, IT networks, wireframes, mind maps and over 70 other types of charts. And there are numerous templates for marketing, strategy development, IT, networking, education and engineering to name a few. With Creately, all the members of your team can work on the same document simultaneously from anywhere around the globe.
There is a free plan for up to three collaborators, five documents and one folder. To have unlimited documents, you can sign up for a Personal or Team plan for $5 or $25 per month, respectively.
Mural
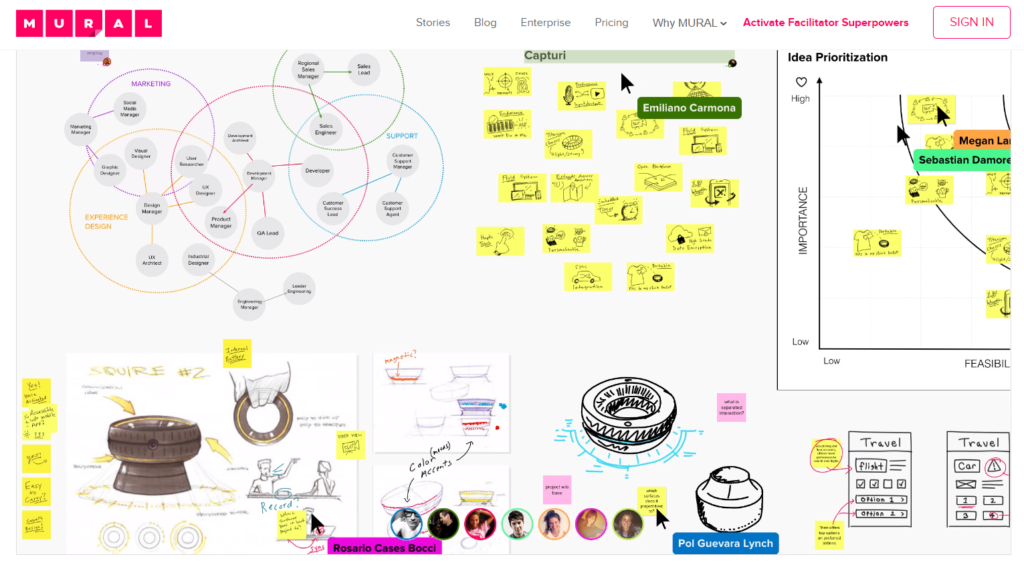
Mural is a great workspace for online visual collaboration with hundreds of templates to help you plan, design and evaluate your project, brainstorm with your team and assess the prospects. New features are added on a regular basis. Also, you should check Mural’s Facilitator Superpowers aimed at running workshops.
There is a 30-day free trial, and premium subscription cost starts from $12 per member per month.
Timelines
Presenting your product development strategy as a timeline or analyzing a chain of events in the past will be more efficient and illustrative in a visual format. Below, you’ll find a couple examples of online timeline makers.
Timetoast
Timetoast is an application for creating timelines in horizontal and list modes, compatible with any type of device. Timelines are embeddable so you’ll be able to add them to your blog. Also, the program allows project collaboration.
Timetoast has a free plan for one user and one timeline draft. To avoid ads, go premium and purchase a Basic plan (five users) for $5.99 per month or a Pro subscription (35 users) for $8.99 per month. The annual subscription features two free months.
Preceden
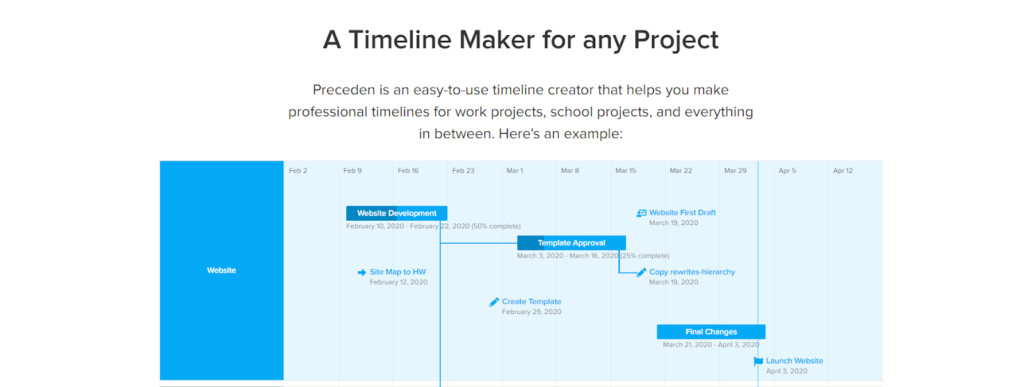
Preceden is an online tool for building timelines and roadmaps for your project, compatible with both PC and Mac. It features an intuitive interface suitable even for beginners. It allows you to create a timeline with multiple layers to separate different activities, but you’ll still be able to see all the project development events on one page. There are various sharing options. You can download it as a PDF, share the timeline’s URL, embed it on your blog or export as a CSV file.
There is a free plan which allows users to create one timeline with up to ten events, as well as premium plans for unlimited timelines and roadmaps from $29 to $179 per year.
Specific Tools
Infographics are a compelling form of presenting the information. Why not use it in your everyday life? With the tools listed below, you can track photos on your phone, impress partners with an infographic resume or present the results of your research.
PhotoStats

PhotoStats is an application for tracking the history of photos on iOS and Android devices. You can tag your pictures, visualize statistics in the form of charts and infographics and export it in CSV and JSON formats. This tool will help you easily find a relevant photo by its tag, keep track of your shots and more, which might be really useful for bloggers.
Vizualize.me
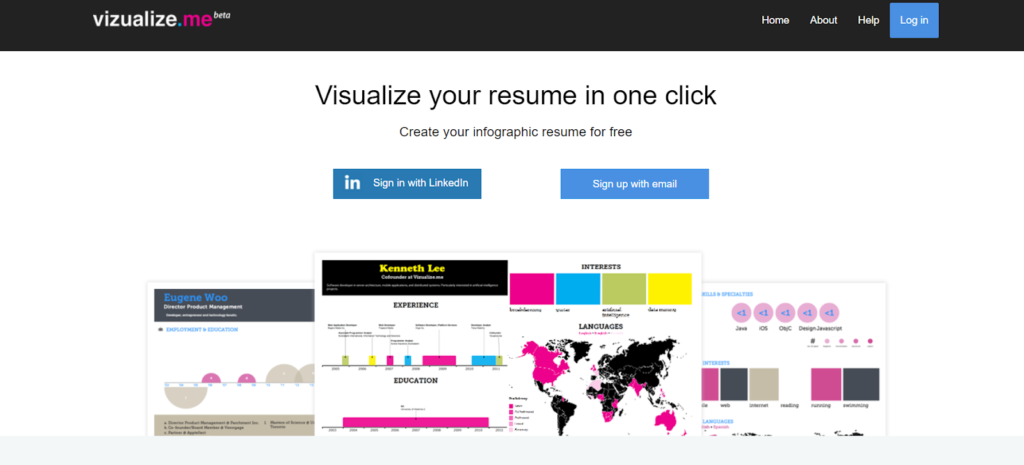
This is a great tool for presenting your resume in a visual format to make it even more compelling. Create an impressive and easy-to-read CV in a few clicks. Present your professional experience with the help of a timeline, show language skills on a map, use a bubble chart to illustrate skills and more.
Here are a few insights into the platform features:
Mind the Graph
Mind the Graph is an online infographic tool for creating visual abstracts, slideshows and graphics to better communicate your findings and insights to your audience. If you want to illustrate your research, Mind the Graph offers various templates, layouts and more than 6,000 graphics tailored to scientific purposes.
There is a limited free plan with one simultaneous editable figure, up to five scientific illustrations and one external file for uploading. Premium subscription starts from $5 per month.
Best Infographic Tools
If you have complex data to present and want to increase comprehension for readers, infographic tools might be the right choice. They help communicate information in the form of graphs, charts, roadmaps and timelines so that readers are not overwhelmed with analyzing large amounts of data. Most tools are cloud-based and feature a free plan. Using infographic software online allows you to save space on your own device by keeping data in secure cloud storage so you can access it from any device.