How to Get Twitter Analytics
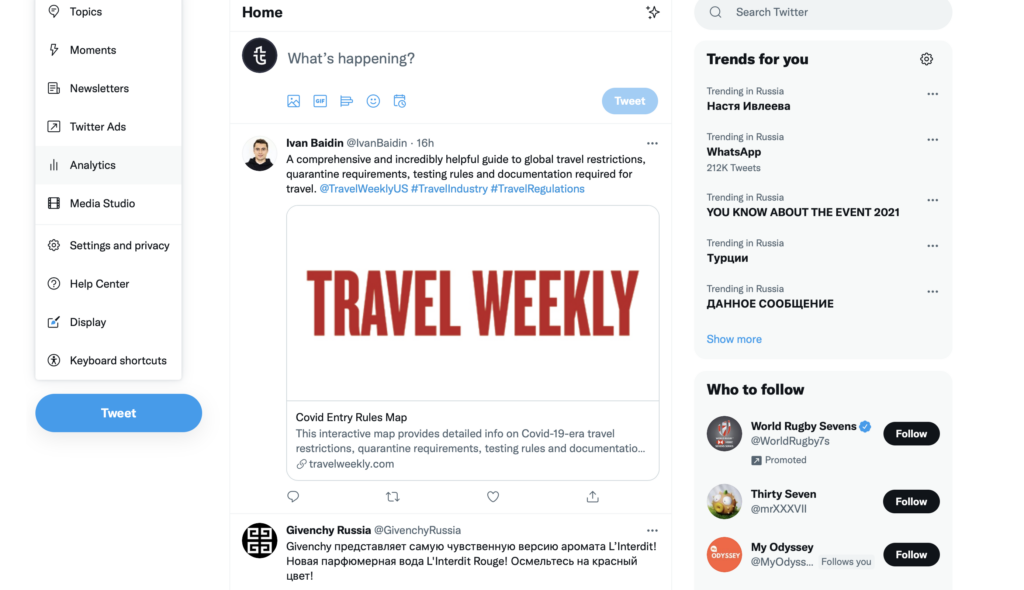
What is Twitter Analytics? The platform offers built-in analytics that allow you to view tweet activity and obtain Twitter audience insights. To access the tool, open your Twitter account, click “More” in the left sidebar and choose the “Analytics” tab from the drop-down menu.
Twitter Analytics Overview
Twitter Analytics offers insights on general account performance, individual tweet performance, and audience demographics. Insights are available for all accounts by default, but you can also connect the Tweet Activity Dashboard and Video Activity Dashboard by signing up at ads.twitter.com or analytics.twitter.com. Twitter Analytics not working? Contact the support team or check the knowledge base.
Home
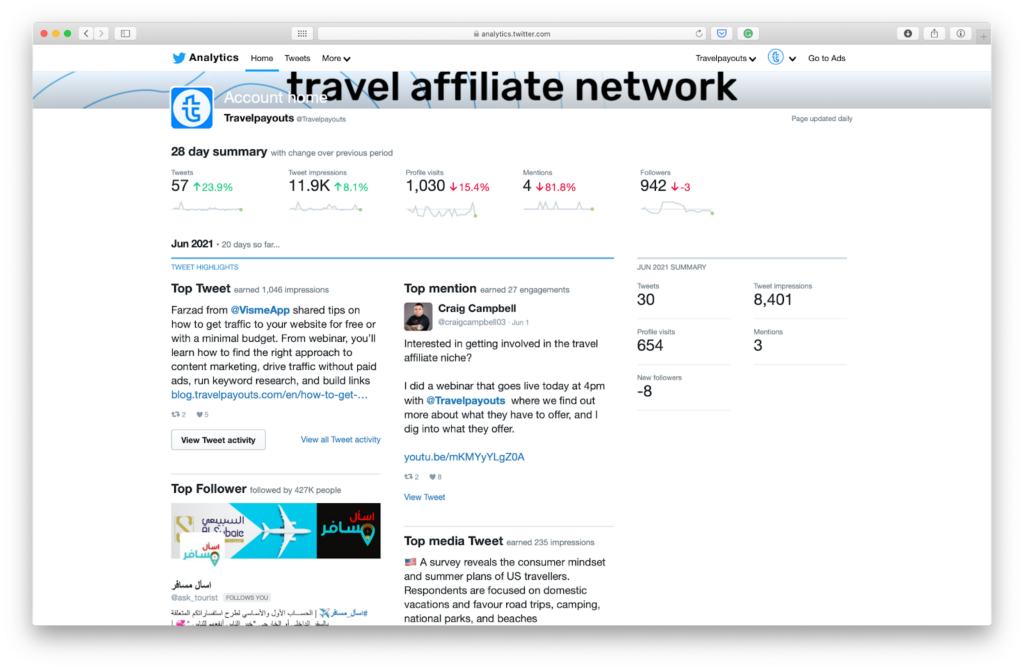
The Home dashboard is the first thing you will see in Twitter Analytics. It offers a snapshot of the most important metrics within the last 28 days, such as:
- Number of tweets
- Tweet impressions
- Profile visits
- Mentions
- Followers
You can also see your best performing content, such as:
- Top tweet: The post with the highest number of impressions
- Top mention: The tweet mentioning your @account with the highest number of impressions
- Top follower: The user with the most followers who started to follow you in the last month
- Top media tweet: The photo or video tweet with most impressions
- Top tweet card: The Twitter card post with most impressions, including other people’s tweets
Tweets
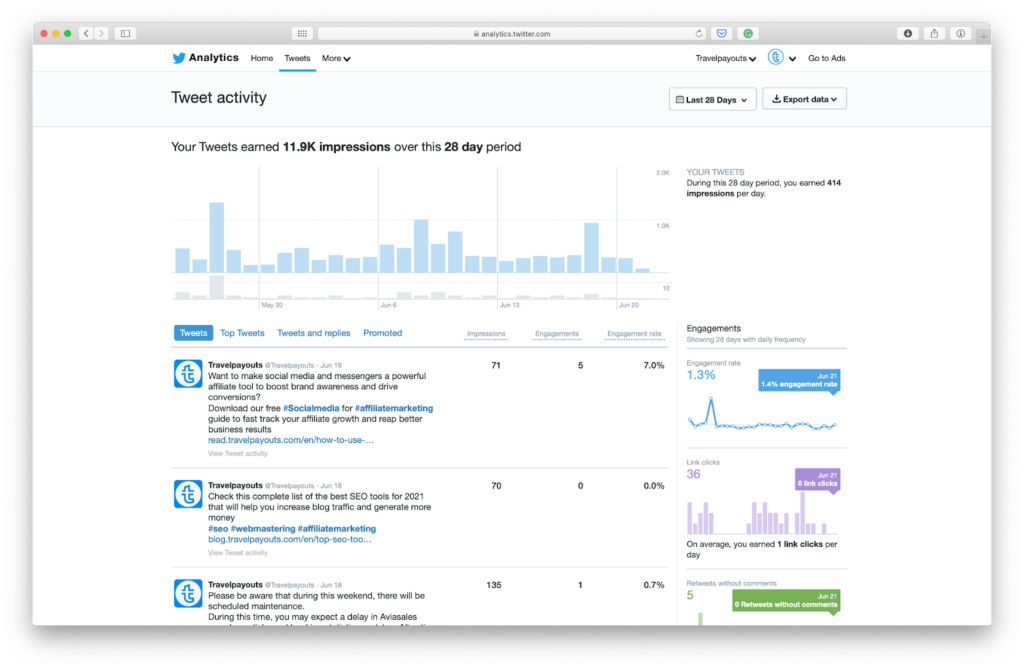
The Tweets dashboard allows you to view tweet activity in the form of a day-by-day breakdown displayed on a graph. You’ll see link clicks and likes per day here. Below the graph, there are insights for your individual tweets, such as impressions, engagements, and overall engagement rate. In the right sidebar, you can see details on engagements for the last 28 days, including:
- Engagement rate
- Link clicks
- Retweets without comments
- Likes
- Replies
Video
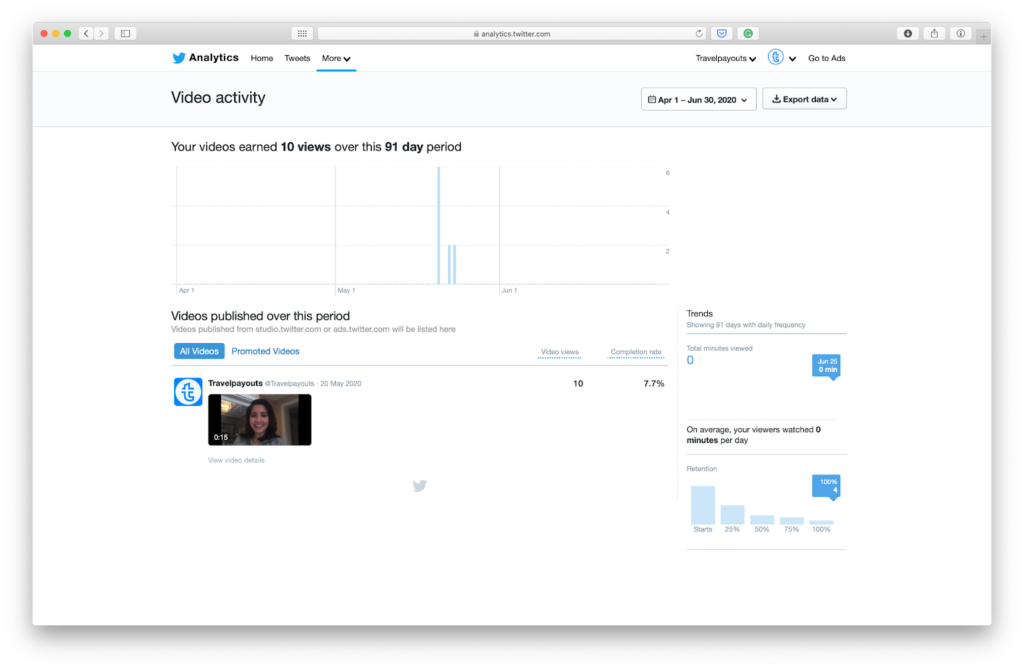
If you navigate to the “More” section from the menu, you’ll see a drop-down menu, and the first tab will be “Video Activity”. It resembles the Tweets tab, but is specifically for video content that you’ve published from studio.twitter.com and ads.twitter.com. Here, you can see metrics, such as:
- Number of views
- Completion rate
The right-hand bar shows trends with daily frequency:
- Total minutes viewed
- Retention
Conversion Tracking
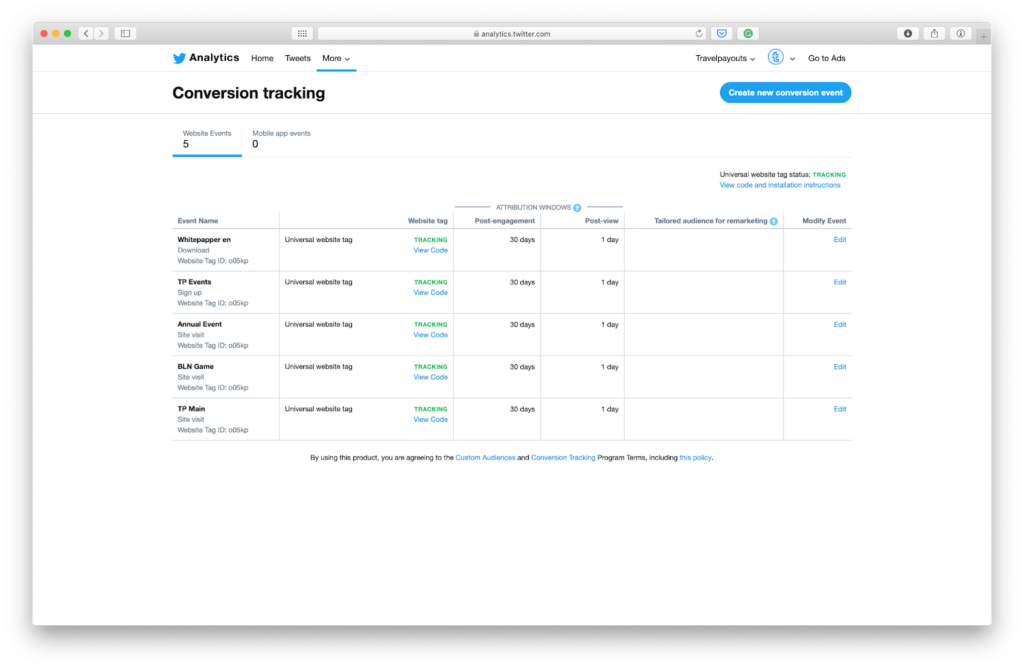
The final tab (“Conversion tracking”) shows the results of advertising activities. You can switch between website and mobile events to analyze installs, registrations, or purchases. If you set up a website tag, you’ll be able to check your website conversion tracking analytics.
What Metrics Should I Track?
Now that you know how to find Twitter analytics, it’s important to understand which metrics to focus on to achieve your campaign goals. Indicators can be broadly divided into accounts, tweets, and ad metrics for promoted content.
Account Metrics
Start by analyzing your overall account metrics. On the homepage of the analytics dashboard, you can find a 28-day summary of your account performance as well as data for previous months. To see if you’re going in the right direction, take a look at the following metrics:
- Twitter follower growth. Track how your following has increased over the last month. If you see notable changes on a particular day, check to see what you tweeted at the time to understand the cause.
- Profile visits. At the top of the dashboard, you can also see the number of visits to your account. This metric will help monitor your reach.
- Mentions: These are all the times other users have mentioned your @account in their tweets. The dashboard also shows your top mentions calculated by engagement.
Tweet Metrics
You can dive deeper into the analytics and assess the performance of individual tweets. Here are a few metrics to check:
- Engagement rate. The number of replies, retweets, follows, links, hashtags, etc. divided by the number of impressions. Low engagement may point to gaps in your strategy. Rethink topics, types of content, hashtags, and other parts of your tweets.
- Twitter impressions. You’ll see all of your tweets and their impressions. Look at the tweets with the most impressions and consider repurposing them or creating posts on similar topics. Also, if you compare your month-over-month performance and see an increase in impressions at some point, try to analyze what you did differently that month.
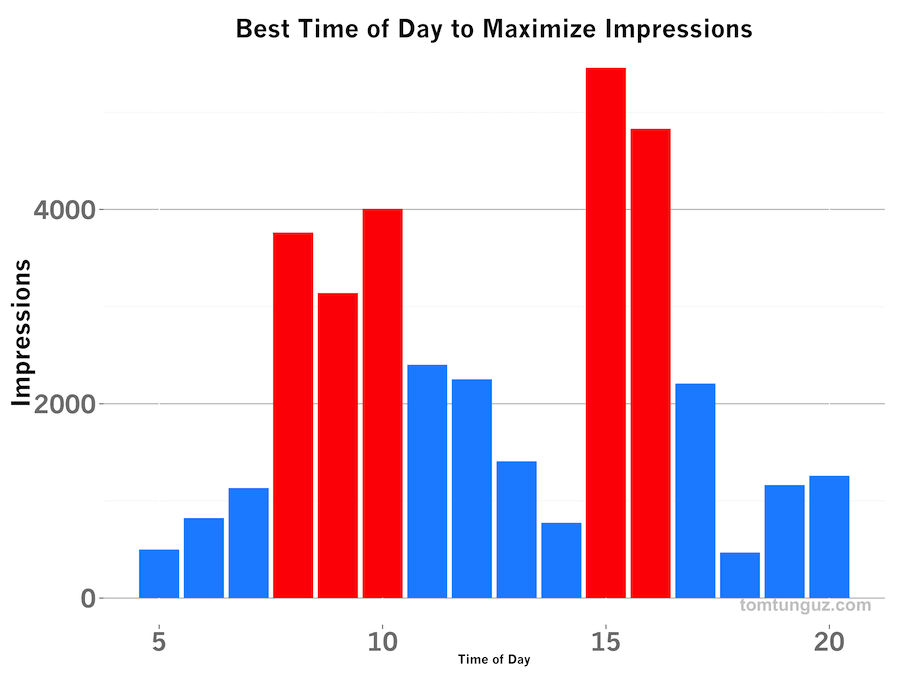
- Twitter impressions (by time of day): This metric can be pulled using special tools based on when your followers are typically online. Use these insights to identify the best posting time and maximize impressions.
- Top tweets. You can see your most popular tweets and media tweets by number of impressions. Check engagement like link clicks and more for a specific tweet in the “View Tweet activity” tab. When you see all top tweets in one table, you can check what commonalities they have that may be the reason for their success.
Ad Metrics
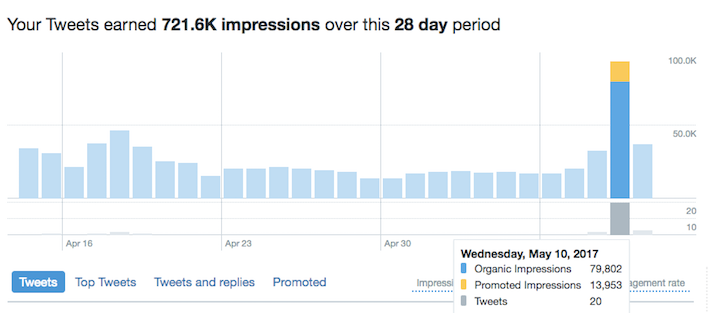
Check the Tweets tab to get an overview of your paid tweets. Hover over the chart to see precise numbers. Promoted impressions are marked in yellow. Note that this data is only available for the last 91 days, so make sure to export it regularly to avoid losing any data. Click “Promoted” to see your paid promotions chronologically, such as engagements and impressions they earned.
How to Use Twitter Analytics to Improve Your Marketing
Twitter Analytics offers tons of insights into the performance of your tweets, which can be invaluable for adjusting your marketing strategy. Below, you’ll find five ways to take advantage of the analytics feature and make your moves more efficient.
1. Discover Your Best Tweets
To begin, Twitter Analytics can help you discover your best-performing content instead of guessing what your followers want to see. Check the “Top Tweets” section in the “Tweet Activity” tab to see what kind of tweets resonate with your audience the most. Next, use that data to give your users more of what they like and accentuate successful content.
2. Identify Trends in Performance
Once you have your best tweets in front of you, it’s time to identify trends and use them to adjust the marketing strategy. Look for:
- Common themes – Do your tweets use the same hashtags, mentions, or questions that could be the reason for their success?
- Particular times or days in which you receive the most engagement
- Recurring vocabulary – Export your top tweets into a word cloud to see vocabulary trends and use them in your future trends
Regularly checking your month-over-month performance will allow you to notice how your followers interact with your content and make smarter decisions later on. Then, if you discover patterns in when your tweets tend to get the most engagement, you’ll be able to post at optimal times and increase your chances of reaching more users. For example, research shows that tweets get the most impressions from 8am to 10am and from 3pm to 4pm.
Keep an Eye on Your Competition
Competitor research can give you plenty of insights as well as help you find gaps in your strategy and strengthen it. You need to track important metrics and compare the performance of your top competitors against your own.
If you don’t have a list of your direct competitors, here is what you can do. Start by checking which brands your followers connect to on Twitter. It’s likely that they follow several different companies within your niche. This will allow you to identify other businesses with related profiles. Next, check common hashtags that you and your rivals might share. Finally, use the good old Google search to track competing businesses with the help of relevant keywords. Check both organic and paid searches. If brands spend money on ads, they take their business seriously.
Once you find your top competitors, take a look at their metrics, such as:
- What types of tweets they post
- How often they tweet
- What hashtags they use and how many
- Whether or not they respond to comments
- Their engagement rate
Also, make sure to track Twitter followers of your competitors to understand what kind of users might also be interested in your content.
Analyze Your Audience
If you track your Twitter follower growth and demographics, you can find plenty of useful insights that will help tailor content to your audience and boost engagement. To do this, you’ll need to leverage dedicated tools that can pull your audience data, like Tweepsmap. There, you can find Twitter follower demographics, such as languages, occupations, genders, etc. Adjust your strategy based on this data. For example, create Twitter accounts for other languages if they are relevant for your audience.
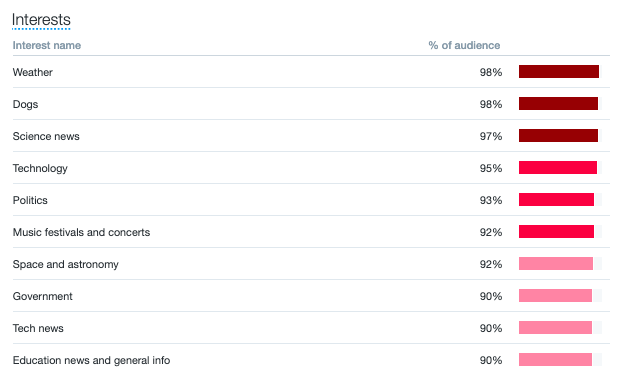
Combine this knowledge with the information about which topics and what kinds of posts are most relevant for your followers and you’ll have a perfect recipe for Twitter success. For example, SproutSocial allows you to look up info about your followers’ interests, lifestyles, and more.
Monitor Keywords
Make sure to monitor relevant keywords on Twitter. This will help you bring the best topics and hashtags to the surface in order to create efficient campaigns and track the performance of those campaigns over time. You can analyze keywords with dedicated tools, which allows you to check keywords’ volume, growth, etc.
The Best Twitter Analytics Tools
Whether you want to check Twitter followers, spy on competitors, or engage with leads, dedicated analytics tools may come in handy and help you gather deeper insights.
With Hootsuite, you can do the following to get insights into your Twitter performance:
- Upload and share media content
- Schedule tweets
- Answer, track, and assign direct messages in a convenient interface
- Choose a metric, track your progress, and generate visual reports
Pricing starts from €39 per month and there is a 30-day free trial available.
Buffer is a user-friendly tool that allows you to monitor performance on Twitter and other social networks with an intuitive analytics interface. You can:
- Compare organic and paid results of your boosted posts
- Monitor engagements for your account
- Measure performance of your tweets and hashtags
- Dig into the demographics of your Twitter audience
- Find suggestions for content development
Use Buffer’s functionality with a 14-day free trial and purchase premium plans starting from $35 per month.
TweetDeck allows users to see multiple timelines in a single interface and offers a slew of advanced features to manage Twitter performance. You can:
- Manage multiple accounts
- Schedule posts
- Build connections on the platform
- Keep up with the latest trends and hashtags
TweetDeck is a free tool that is available for anyone with a Twitter account. The program can be used only on desktop. At the moment, there is no mobile app.
SproutSocial is an industry-leader in social media analytics, management, customer care, and advocacy. This tool allows you to monitor social trends, provide support to your customers, manage social presence, plan and publish content, and more.
SproutSocial makes it easy to identify your best-performing tweets and prepare reports to measure your strategy for success. The Twitter Trends Report will help you discover trending themes and hashtags and boost your content strategy.
If you wonder how to view Twitter analytics for free, try Followerwonk. With this tool, you can:
- Search Twitter bios
- Compare accounts to target new influencers
- View audience demographics, such as locations, bios, follows, etc.
- Check your account against competitors and other users
- Analyze changes in your following and match them to your activities
With a free account, you can search up to 50 Twitter profiles, run 20 analyses/comparisons per day, and analyze accounts with up to 25,000 followers. Premium plans start from $29 per month.
How to Use Twitter Analytics
Social media is a rapidly changing environment. For modern brands, there is no need to stay locked in to a particular strategy for a long time. Knowing how to use Twitter Analytics can be a game-changer for your social media strategy. Start by aligning your goals and determining which metrics are benchmarks for success. Analyze your past performance and see what kind of content has resonated the most with your audience. Check your profile against your competitors and try to spot holes in your strategies. Doing all of this will allow you to make smarter business decisions and take your strategy to the next level in no time.


